Network Enhancers - "Delivering Beyond Boundaries" Headline Animator

Thursday, August 30, 2012

Cisco Preps 'Arista Killer'

 
Cisco Systems Inc. (Nasdaq: CSCO) is preparing to release a top-of-rack switch that it's been touting as an Arista Networks Inc. killer, Light Reading has learned.
 
The Nexus 3500, which sources say was originally designed by the team now running Insieme Networks Inc. , is reportedly a low-latency switch built for cloud networks where virtual machines get moved around a lot. Both are factors that Arista boasts about with its own switches.
In fact, Arista is running a demo here showing off its virtual-machine capabilities. It was the subject of an Arista press release Friday.
The Nexus 3500 reportedly will be based on a Broadcom Corp. (Nasdaq: BRCM) Ethernet switching chip -- the Trident II that was announced Monday, according to one source. But sources say it's also going to include an application-specific integrated circuit (ASIC) for Layer 3 multicast -- which is necessary for a virtual machine, after it's been moved, to communicate with the rest of the network.
That ASIC was designed by the team at Insieme, Cisco's spin-in startup run by the same team that did Cisco's Nuovo and Andiamo spin-ins, sources agree. The team has been moved off that product and onto the next big thing -- possibly a super-dense 100Gbit/s switch, as Light Reading reported Friday.
Let's get virtual
That Layer 3 ASIC would be useful for a technology called virtual extensible LAN (VXLAN), developed by VMware and partners. VXLAN moves virtual machines via a Layer 3 tunnel (technically, it encapsulates the packets so that the Layer 3 network can move them around). Normal virtual-machine movement happens at Layer 2, but VXLAN is more scalable and can cross network boundaries.
VXLAN, which VMware just started shipping, is one of a few technologies being proposed for this task. Microsoft has its own version, called NVGRE.
 
Arista's VMworld demo shows VXLAN hardware virtual endpoints running inside a switch, one that's part of the 7000 family but hasn't yet been announced, says Doug Gourlay, Arista's VP of marketing.
The technologies are relatively new, so Arista is trying to grab a leader's position in supporting them. That's the purpose of this week's demo, which shows interoperability with some big-name companies including F5 Networks Inc. (Nasdaq: FFIV), Palo Alto Networks Inc. and the Isilon branch of EMC Corp. (NYSE: EMC).
As is often the case, interoperability is important for smaller players like Arista, because they're up against all-in-one offerings from the bigger names, such as Cisco and VMware Inc. (NYSE: VMW).
"This has become a game of stacks. Cisco's got a stack. VMware's got a stack. Oracle Corp. (Nasdaq: ORCL) has a stack. This is how Arista can counter that," says Zeus Kerravala, principal analyst with ZK Research . It's aligning itself with the right companies -- F5, Palo Alto. That's a Who's Who."
Lowering latency

But getting back to that Nexus thing. The 3000 line is the variety of Nexus that's built specifically for low latency, targeting markets such as financial trading. It's also one of Cisco's first product lines to dabble in the OpenFlow protocol, at least according to one engineer last fall.
Kerravala wouldn't discuss the 3500 specifically, but he did think that an ASIC-based Nexus 3000 would be a logical next step. Cisco, which tends to be ASIC-happy, has been using merchant Ethernet chips in the Nexus 3000 series.
Network World uncovered some more details about the 3500 earlier in August, finding that the switch will have low enough latency to rival InfiniBand gear. Low latency has made InfiniBand, rather than Ethernet, a favored data-center fabric protocol.
Gourlay declined to comment on the existence of a potential Arista killer at Cisco. A Cisco spokeswoman declined comment as well.
 

AWS - VPC Networking for Beginners


Courtesy - Ranjib Dey

I have worked very little in networking. I have seen L2/L3 hardwares, but I never got an opportunity to configure, deploy or automate them. As we experience the "cloudification" of traditional IT, some of the core IT services are already mature enough for production uses, or large-scale deployments. Storage (s3 , openstack-swift), block storage (EBS) or compute (ec2, openstack nova) are a few. What always excited me is understanding how much network automation is possible in public or private clouds. It is important for broader cloud adoption.

I know there are significant innovations happening in that space, too. OpenFlow might be the openstack equivalent in that space. Together they give you openfabrics. A cloud that accommodates your networking devices along with SAN and rack servers.

I have done some preliminary work on AWS-VPC, and I am jotting down my learnings from it. I always read about these concepts, but never understood what they meant. So remember, if you are on AWS-VPC, and you do not have prior experience with networking, this might be helpful to you:

VPC

A "Virtual Private Cloud" is a sub-cloud inside the AWS public cloud. Sub-cloud means it is inside an isolated logical network. Other servers can't see instances that are inside a VPC. It is like a vlan AWS infrastructure inside a vlan.

In non-VPC AWS cloud, the normal one all servers get a public ip. This is used to access the instance from outside. But if you run `ip addr show` you'll see it has a private ip. The instance itself is not aware of its public ip (its probably NAT-ed with the public ip in their switch). The information about private ip is also important as communications using private and public ip's incur different cost schemes (public ip based communications incur some cost). But the point is every single instance is visible, their names are and ips are reused. These things have significant impact on how you design and implement your network security as well. Security groups, which selectively allow individual types of ingress or incoming traffic, becomes more important.

A VPC is denoted by a subnet mask. For example, when one says VPC-x is 10.123.0.0/16 , that means any instances inside this VPC will have an ip 10.123.X.Y where X and Y can be anything between 2 to 254. A VPC can have following global components:
  • A DHCP option set (server that assigns dynamic ips )
  • Internet gateway (will come to this shortly)
  • One or more subnets
  • One or more routing tables
  • One or more network ACLs
Subnets: A subnet is a sub-network inside a VPC. An example of a subnet inside a VPC (10.123.X.Y) is 10.123.1.A/24. This means any instance that belongs to this subnet will have an ip 10.123.1.A where A can be anything between 2 and 254. These are also known as CIDR notations.

An instance always belongs to a subnet. You cannot have an instance inside a VPC that does not belong to any subnets. While spawning instances inside AWS-VPC, one must specify which subnet the instance should belong to.

Routing tables: Network traffic of any instance inside a subnet is dictated by a routing table. An example routing table is:

CIDR --- target

10.123.0.0/16 --- local

0.0.0.0/0 - igw (internet gateway)

This table means that any traffic destined for 10.123.X.Y ip (where X and Y can be anything from 2 to 254) will be sent directly. The rest of the traffic will be directed to igw.

Now, it's important to understand that a subnet is always attached to one and only one routing table. So, if we spawn an instance inside a subnet that has the above-mentioned routing table attached to it, the instance still won't be accessible from outside VPC because it does not have a public ip. One can attach an elastic ip (which is a reusable public ip) to this instance and then access it. The instance in turn can access the internet. Remember, for an instance to be directly available from the internet it has to have an elastic ip and it must be within a subnet that has a routing table where non-local traffic is routed via an internet gateway. So, an elastic ip and an igw in the routing table are two criterion for an instance to be available directly from the internet. Subnets with such routing tables attached to them are also known as public subnets (non-local traffic routed to internet gateway), as any instance with an elastic ip can be publicly available from this subnet.

On the other hand, you can specify a NAT (a gateway) instance as a target for non-local traffic inside a routing table. You can keep the NAT box in a public subnet with an elastic ip attached to it. Now any subnet that has this type of routing table attached becomes a private subnet because they cannot be exposed publicly. Even if you assign an elastic ip, it won't be publicly available (recall, for instance, to be publicly available means you need both an elastic ip as well as a routing table that directs non-local traffic to the internet gateway). Here's an example of a private subnet:

CIDR --- target

10.123.0.0/16 --- local

0.0.0.0/0 - i-abcdef (instance ip of the NAT box)

Network ACLs, or network access control lists: Apart from routing tables, each subnet also assigned a network ACL. Network ACLs specify what type of traffic is allowed inside the subnet. By default it might have the following rules:

rule number --- port --- protocol --- source -- action
100 ---- ALL --- ALL --- 0.0.0/0 -- allow

This means that all traffic is allowed within this network. You can think of Network ACLs as subnet-wide security groups. They are effective while isolating subnets from each other, reducing the collision of domains, etc.

Entities such as RDS's and ELB's can be provisioned within VPC as well. The same rule applies for them as other ec2 instances. If they belong to public a subnet, they can be accessed from the internet.
In a typical web application example, you will be spawning the ELB and a NAT box inside the public subnet and your db servers (or RDS instances) and web servers in the private subnet. Since you have a NAT gateway (and a routing table attached to the private subnet that routes traffic via this NAT gateway), instances from private subnets can access the internet. But the reverse is not possible. If you do not want the instances from private subnets to access the internet, you can remove the NAT box from the private subnet's routing table. Since all this can be done dynamically via the web browser based console, command line tools, or AWS webservices api, you can temporarily allow the instances from private subnets to access the internet (like while provisioning) and then revoke it later (before joining the elb).

I'll be writing another post on how you can set up cross-availability zones — highly available services using AWS VPC from a network standpoint. This will serve the foundation of that post.


Wednesday, August 29, 2012

Juniper Research Firm sees Mobile Ad Explosion


This finding is likely to surprise nobody, but market research firm Juniper Research sees advertising on mobile devices multiplying along with a corresponding increase in opportunities and revenues.

That’s the report in a recent study, “Mobile Advertising, Messaging, In-App and Mobile Internet Strategies 2012-2017.”

The study predicts a “dramatic” growth in location-based mobile ads. Report author Charlotte Miller says, “Sending adverts using mobile messaging gives advertisers a simple, cheap and effective way of reaching consumers. Adding location technologies is an even more powerful proposition, particularly for transactional advertising as marketers can reach consumers who are near a location where they can purchase.”

The report touches on types of mobile advertising such as device Internet, in-app or ringtone. It also offers breakdowns of geographic markets such as the U.S., Canada and the U.K.

Juniper estimates the market could growth to about $7.4 billion by 2017. Also examined are business models, brand strategies and methods of selling inventory and delivering mobile device ads to multiple outlets.

It also addresses privacy concerns that arise from the mixing of marketing and smartphones.
 

Cisco Readying New Nexus 3500 Low-Latency Switch


Details are scarce but a mid-September launch for Cisco Systems' new Nexus 3500 top-of-rack switch is in the cards, a product that will reduce latency significantly compared to its current offerings.

Cisco execs aren't denying the switch is coming, but neither are they spilling the beans. Press coverage suggests the 3500 will have port-to-port latency of 250 nanoseconds, way faster than the network giant's current 3064 and 3064-X offerings.


The same coverage also points to a new network interface card (NIC), dubbed unNIC, suggesting that the combination could be pitched as an alternative to InfiniBand. Once, briefly, a champion of InfiniBand, Cisco has for some time thrown its weight behind Ethernet technologies. Meanwhile, Intel has given InfiniBand a boost with its purchase of QLogic's business in that space.


More certainly, the 3500 will mean a leapfrog for Cisco over rival Arista Networks, which offers the 7124SX with port switching latency of around 500 nanoseconds. Meanwhile, the likes of Gnodal claim sub-150 nanosecond switching for its GS7200, and Zeptonics' ZeptoMux clocks in at around 130 nanoseconds. Also, Rockflower Networks is in design/concept stage for its RM200GX-10, claiming a less than 100 nanosecond latency.


Of course, latency isn't the only measure of a switch. Low jitter, ability to cope with microbursts, buffer analytics, precision time support, layer 3 network protocol support, and management are also factors. As is price. In the future, add to that intelligence, which Arista has a lead in, with its 7124FX, featuring an internal FPGA chip for application logic.
 

Cloud Computing Technical Interivew Questions - Part 1


1. What is cloud computing?
The cloud computing is the computing which is completely based on the Internet. It can also be defined as the next stage in the evolution of the Internet. The cloud computing uses the cloud (Internet) that provides the way to deliver the services whenever and wherever the user of the cloud needs. Companies use the cloud computing to fulfill the needs of their customers, partners, and providers. The cloud computing includes vendors, partners, and business leaders as the three major contributors. The vendors are the one who provide applications and their related technology, infrastructure, hardware, and integration.

The partners are those who offer cloud services demand and provide support service to the customers. The business leaders are the ones who use or evaluate the cloud service provided by the partners. The cloud computing enables the companies to treat their resources as a pool and not as independent resources.
2. What is a cloud?
cloud is a combination of hardware, networks, storage, services, and interfaces that helps in delivering computing as a service. It has broadly three users which are end user, business management user, and cloud service provider. The end user is the one who uses the services provided by the cloud. The business management user in the cloud takes the responsibility of the data and the services provided by the cloud. The cloud service provider is the one who takes care or is responsible for the maintenance of the IT assets of the cloud. The cloud acts as a common center for its users to fulfill their computing needs.
3. What are the basic characteristics of cloud computing?
The four basic characteristics of cloud computing are given as follows:
  • Elasticity and scalability.
  • Self-service provisioning and automatic de-provisioning.
  • Standardized interfaces.
  • Billing self-service based usage model.

4. What is a Cloud Service?
A cloud service is a service that is used to build cloud applications. This service provides the facility of using the cloud application without installing it on the computer. It reduces the maintenance and support of the application as compared to those applications that are not developed using the cloud service. The different kinds of users can use the application from the cloud service, which may be public or private application.
5. What are main features of cloud services?
Some important features of the cloud service are given as follows:
  • Accessing and managing the commercial software.
  • Centralizing the activities of management of software in the Web environment.
  • Developing applications that are capable of managing several clients.
  • Centralizing the updating feature of software that eliminates the need of downloading the upgrades.

6. How many types of deployment models are used in cloud?
There are 4 types of deployment models used in cloud:
  1. Public cloud
  2. Private cloud
  3. Community cloud
  4. Hybrid cloud


7. What is the AppFabric component?
The AppFabric component is used to create access control and distribute messages across clouds and enterprises. It has a service-oriented architecture, and can be considered as the backbone of the Windows Azure platform. It provides connectivity and messaging among distributed applications. It also has the capabilities of integrating the applications and the business processes between cloud services and also between cloud services and global applications.

The AppFabric component provides a development environment that is integrated with Visual Studio 2010.TheWindows Communication Foundation (WCF) services built in VS 2010 can be published on cloud from the Visual Studio design environment.

The two important services of AppFabric are as follows:
  • Access Control Service (ACS) - Allows rules-driven and claims-based access control for distributed applications. These claims-based rules and authorization roles can be defined in the cloud for accessing on-premise and cloud services. The claim can be a user or application attribute, which the service application expects, such as e-mail address, phone number, password, and role, for appropriate access control. When any application wants to use the Web service, it sends the required claims to ACS for requesting a token. ACS converts the input claims into output claims by following the rules of mapping. These rules are created during the configuration of ACS. The ACS issues a token containing the output claims for the consumer application. This application uses this token in the request header and sends to the Web service. This service validates the claims in the token and gives suitable access to the user.
  • Service bus - Provides messaging between cross-enterprise and cross-cloud scenarios. It provides publish/subscribe, point-to-point, and queues message patterns for exchange of messages across distributed applications in the cloud. It integrates with the Access Control service to establish secure relay and communication.

8. Why does an organization need to manage the workloads?
The workload can be defined as an independent service or a set of code that can be executed. It can be everything from a data-intensive workload to storage or a transaction processing workload and does not rely upon the outside elements. The workload can be considered as a small or complete application.

The organization manages workloads because of the following reasons:
  • To know how their applications are running.
  • To know what functions they are performing.
  • To know the charges of the individual department according to the use of the service.

9. Which services are provided by Window Azure operating system?
Windows Azure provides three core services which are given as follows:
  • Compute
  • Storage
  • Management

10. Explain hybrid and community cloud.
The hybrid cloud consists of multiple service providers. This model integrates various cloud services for Hybrid Web hosting. It is basically a combination of private and public cloud features. It is used by the company when a company has requirements for both the private and public clouds. Consider an example when an organization wants to implement the SaaS (Software as a Service) application throughout the company. The implementation requires security that can be provided by the private cloud used inside the firewall. The additional security can be provided by the VPN on requirement. Now, the organization has both the private and public cloud features.

The community cloud provides a number of benefits, such as privacy and security. This model, which is quite expensive, is used when the organizations having common goals and requirements are ready to share the benefits of the cloud service.
11. Explain public and private cloud.
The public cloud (or external cloud) is freely available for access. You can use a public cloud to collect data of the purchasing of items from a Web site on the Internet. You can also use public cloud for the reasons, which are given as follows:
  • Helps when an application is to be used by a large number of people, such as an e-mail application, on the Internet.
  • Helps when you want to test the application and also needs to develop the application code.
  • Helps when you want to implement the security for the application.
  • Helps when you want to increase the computing capacity.
  • Helps when you are working on the projects in collaboration.
  • Helps when you are developing the project on an ad-hoc basis by using PaaS.

The private cloud allows the usage of services by a single client on a private network. The benefits of this model are data security, corporate governance, and reliability concerns. The private cloud is used by the organization when it has a huge, well-run data center having a lot of spare capacity. It is also used when an organization is providing IT services to its clients and the data of organization is highly important. It is best suited when the requirements are critical.

The characteristics of this model are given as follows:

  • Provides capability to internal users and allows provision of services.
  • Automates the tasks of management and provides the billing of consumption of a particular service.
  • Offers a well-managed environment.
  • Enables the optimization of computational resources, such as servers.
  • Manages the workload of the hardware.
  • Offers self-service based provisioning of hardware resources and software.

12. Give a brief introduction of Windows Azure operating system.
The Windows Azure operating system is used for running cloud services on the Windows Azure platform, as it includes necessary features for hosting your services in the cloud. It also provides runtime environment that consists of Web server, computational services, basic storage, queues, management services, and load balancers. The operating system provides development. Fabric for development and testing of services before their deployment on the Windows Azure in the cloud.

13. What are the advantages of cloud services?
Some of the advantages of cloud service are given as follows:
  • Helps in the utilization of investment in the corporate sector; and therefore, is cost saving.
  • Helps in the developing scalable and robust applications. Previously, the scaling took months, but now, scaling takes less time.
  • Helps in saving time in terms of deployment and maintenance.


Monday, August 27, 2012

Juniper VGW Series - Virtual Gateway


Security and compliance concerns are first-order priorities for virtualized data center network and cloud deployments. vGW Virtual Gateway is a comprehensive firewall security solution for virtualized data centers and clouds that is capable of monitoring and protecting virtualized network environments while maintaining the highest levels of VM host capacity and performance. vGW Virtual Gateway includes a high-performance hypervisor-based stateful firewall, integrated intrusion detection (IDS), and virtualization-specific antivirus (AV) protection.
vGW Virtual Gateway provides complete virtual network protection. Its VMsafe-certified virtualization security approach, in combination with “x-ray” level knowledge of each virtual machine through virtual machine introspection, gives vGW Virtual Gateway a unique vantage point in the virtualized network environment. vGW Virtual Gateway can monitor each VM and apply protections adaptively as changes to the VM configuration and security posture make enforcement and alerts necessary.
vGW Architecture
vGW Architecture
vGW Virtual Gateway delivers total virtual data center network protection and cloud firewall security through visibility into the virtualized environment, multiple layers of protection, and a complete set of compliance tools.
  • Visibility: vGW Virtual Gateway has a complete view of all network traffic flowing between VMs, and a complete VM and VM group inventory, including virtual network settings. vGW Virtual Gateway also has deep knowledge of all VM states, including installed applications, operating systems, and patch level, through virtual machine introspection.
  • Protection: Layers of defenses and automated firewall security are provided through a comprehensive package that includes a VMsafe-certified, stateful firewall. This hypervisor-based firewall security provides access control over all traffic using policies that define which ports, protocols, destination and VMs, should be blocked.

    In addition, an integrated intrusion detection engine inspects packets for the presence of malware or malicious traffic and sends alerts as appropriate. Finally, virtualization-specific AV protections deliver highly efficient on-demand and on-access scanning of VM disks and files with the capability to quarantine infected entities.
  • Compliance: Enforcement of corporate and regulatory policies is as much an IT imperative for virtualized workloads as it is for physical ones. The compliance functionality of vGW Virtual Gateway includes monitoring and enforcement of segregation of duties, business-warranted access, and ideal/desired VM image or configuration. vGW Virtual Gateway can continuously monitor and optionally restrict VM access so that it is limited by application, protocol, and VM type. It even monitors administrative roles, providing correct segregation of duties.

    vGW Virtual Gateway also synthesizes virtual machine introspection and vCenter information to create “smart group” policies, which ensure that VMs of a specific type are automatically secured with the appropriate internal or regulatory policy. Finally, the VM Enforcer feature can ensure that any deviation from a VM “gold” image triggers an alert or a VM quarantine in order to reduce the risk associated with configuration errors.
Features And Benefits -


Juniper Networks Delivers Unprecedented Scale and High-Performance Security for Virtualized Environments

 
Newest vGW Virtual Gateway Supports IPv6, Enables Greater Flexibility and Efficiency for Cloud Services Providers 


Today at VMworld® 2012, Juniper Networks, the industry leader in network innovation, announced vGW Virtual Gateway solution enhancements that deliver unprecedented scale for large enterprises and service providers looking to implement a secure virtualized infrastructure, while simultaneously maintaining security, control and compliance.

As demand for cloud services and virtual workloads continues to grow and organizations begin the transition to IPv6, it is essential that security solutions keep pace through greater performance and automation. The latest upgrades to vGW secure both IPv4 and IPv6 protocols, enabling enterprises and service providers to offer efficient and secure services to their global customers. Further, new Cloud API and software developer's kits (SDKs) provide tools that automate security configuration, providing significant cost savings and giving cloud service providers the ability to offer their customers better security controls in a virtual environment.


News Highlights  Security: 

  • Upgrades to vGW offer firewall enforcement and policy administration for IPv6 either alone or, optionally, with IPv4 to enable more flexibility and greater efficiency for protecting traffic.

  • Automation:
    • The vGW Cloud API and SDK enable businesses to create customized portals that provide their customers with self-service access to VM and security provisioning on an on-demand basis.
    Scale:
    • New vGW management enhancements facilitate security for large-scale multi-tenant cloud deployments by offering more granular and customizable security segmentation.
      • For service providers with business plans to scale their VM hosting service, this means unprecedented levels of scale as well as high-performance automation and security.
      • For enterprises that need granular layered defenses to protect their VMs, vGW will enable an extremely scalable and cost-effective virtualization security management solution.
    VMworld Speaker Highlights:
    • Johnnie Konstantas, director of product marketing for Juniper's cloud security, and Darrell Hyde, director of architecture for Hosting.com, will present a session focused on 'Securing the Cloud' to be held at Floor Solutions Center on Tuesday, Aug. 28, 11:30 a.m. PDT.
    Supporting Quotes

    "Hosting.com's Cloud Firewall product, which is powered by the vGW platform, enables our customers to feel secure in our cloud while also providing them a simple, self-service user experience to build and scale their security policies. The scalability, automation enhancements and introduction of IPv6 support in vGW will enable us to build on that experience while ensuring that we're always ready to scale to meet the capacity needs of our customers."

    Darrell Hyde, director of architecture, Hosting.com

    "Trends show that virtualization security continues to be an integral component of the new network and data center. Juniper Networks vGW Series addresses the toughest business challenges customers are facing by providing cloud-enabling, purpose-built security and integrating virtualization security with physical network security. Implementing vGW Series will enable service providers and enterprise customers to deliver powerful high-performance security for virtualized environments of the largest scale."

    Johnnie Konstantas, director of product marketing, Security Business Unit, Juniper Networks

    Availability

    The Juniper Networks vGW Virtual Gateway will be available September 2012. Juniper will be showcasing live demonstrations of vGW during VMWorld 2012 in the Juniper Networks booth #1517. 
     

    V3 Systems Launches New Intel-based Desktop Cloud Computing Appliance

     
    - Next generation VDI hardware shown at VMworld 2012 provides higher density, faster performance, and reduced cost-per-desktop thanks to Intel's architecture and V3's VMware optimizations -
     
    V3 Systems, the industry leader in Desktop Cloud Computing (DCC), announced today the expansion of its virtual desktop appliance line featuring new Intel processors and SSDs in a streamlined 1U chassis.
     
    V3 Systems will be demonstrating this new line of hardware VDI appliances at booth No. 1809 during VMworld 2012 in San Francisco.
     
    The first two models in the next generation product line are the V-E523 and V-E529 appliances. Both products offer lower costs-per-desktop, faster performance and higher desktop densities for V3's customers.
      
    The models are configurable with up to 1.7 TB of Solid State Storage and 16 CPU cores supporting up to 250 concurrent virtual Windows desktops. V3 Systems certifies the scaling of virtual Windows desktops on its appliances to guarantee every desktop running on its appliance will provide speed and performance of two to eight times that of a typical physical Windows desktop.
     
    "V3 Systems' enterprise and SMB customers are raving about V3 adding the Intel platform to our line of Desktop Cloud Computing appliances," said Peter Bookman, V3 Systems Co-Founder and CEO. "The combination of V3's unique VDI architecture and the new Intel platform translates to overall cost savings, better performance, and higher virtual desktop densities than we've ever seen. V3 Systems always guarantees the same level of performance from the first VM to the last VM on every single appliance we sell. Adding the Intel platform to our new appliances gives us more flexibility to deliver upon that guarantee."
     
    "Intel worked with V3 Systems to test and select the perfect combination of Xeon® E5 processors, SSDs, and Server Boards and Chassis to meet V3 Systems' extremely high level of scrutiny," said David L. Brown, Director of Marketing for Intel Corporation's Enterprise Platforms & Services Division. "V3 Systems guarantees the performance of every virtual desktop running on its appliances, so it was clear that they needed a no compromise solution. The Intel S2600GZ based system with dual Xeon® E5 processors fit the bill perfectly, helping to reduce costs while increasing performance and reliability for V3 Systems' customers."
     
    For further information contact your V3 Systems Solution Expert today at 1-800-708-9896 or sales@v3sys.com.
     
    About V3 Systems
     
    V3 Systems is the first and only stack-agnostic desktop cloud management solution in the market today. V3 delivers a Desktop Cloud Computing appliance that offers the flexibility of persistent, non-persistent, and hybrid pool deployment across multiple virtual stack environments such as Microsoft or VMware. V3's Desktop Cloud Orchestrator is specifically designed for the desktop administrator and offers flexible pool creation and management. In addition it provides policy-based pool movement administration for failover, resource allocation, time/usage reporting, geographic pool allocation, and type-switch management (persistent to non-persistent). Delivered with V3's high performance purpose-built desktop cloud appliance, V3 guarantees that its solution will perform faster than any desktop available today with a consistent density and cost for any size of desktop cloud deployment. Simplicity and elegance of design allow swift installation and high end-user satisfaction. Visit www.v3sys.com to learn more.

    Read more here: http://www.sacbee.com/2012/08/27/4760689/v3-systems-launches-new-intel.html#storylink=cpy
     

    Cisco Global Cloud Index: Forecast and Methodology, 2010-2015


    What You Will Learn

    The Cisco® Global Cloud Index is an ongoing effort to forecast the growth of global data center and cloud-based IP traffic. The forecast includes trends associated with data center virtualization and cloud computing. This document presents the details of the study and the methodology behind it.

    Forecast Overview

    Global data center traffic:

    • Annual global data center IP traffic will reach 4.8 zettabytes by the end of 2015. In 2015, global data center IP traffic will reach 402 exabytes per month.

    • Global data center IP traffic will increase fourfold over the next 5 years. Overall, data center IP traffic will grow at a compound annual growth rate (CAGR) of 33 percent from 2010 to 2015.

    Data center virtualization and cloud computing transition:

    • The number of workloads per installed traditional server will increase from 1.4 in 2010 to 2.0 in 2015.

    • The number of workloads per installed cloud server will increase from 3.5 in 2010 to 7.8 in 2015.

    • By 2014, more than 50 percent of all workloads will be processed in the cloud.

    Global cloud traffic:

    • Annual global cloud IP traffic will reach 1.6 zettabytes by the end of 2015. In 2015, global cloud IP traffic will reach 133 exabytes per month.

    • Global cloud IP traffic will increase twelvefold over the next 5 years. Overall, cloud IP traffic will grow at a CAGR of 66 percent from 2010 to 2015.

    • Global cloud IP traffic will account for more than one-third (34 percent) of total data center traffic by 2015.

    Regional cloud readiness:

    • North America and Western Europe lead in broadband access (fixed and mobile). Asia Pacific leads in the number of subscribers due to the region's large population.

    • Western Europe leads in fixed average download speeds of 12.2 Mbps, followed by Central and Eastern Europe with 9.4 Mbps, making these regions the most cloud ready from a download speed perspective.

    • Western Europe and Central and Eastern Europe lead in average fixed upload speeds of 5.9 Mbps and 5.7 Mbps, respectively, making these regions the most cloud ready from an upload speed perspective.

    • Western Europe and North America lead in average fixed latencies with 68 ms and 75 ms respectively, making these regions the most cloud ready from a latency perspective.

    Evolution of Data Center Traffic

    From 2000 to 2008, peer-to-peer file sharing dominated Internet traffic. As a result, the majority of Internet traffic did not touch a data center, but was communicated directly between Internet users. Since 2008, most Internet traffic has originated or terminated in a data center. Data center traffic will continue to dominate Internet traffic for the foreseeable future, but the nature of data center traffic will undergo a fundamental transformation brought about by cloud applications, services, and infrastructure. By 2015, one-third of data center traffic will be cloud traffic.

    The following sections summarize not only the volume and growth of traffic entering and exiting the data center, but also the traffic carried between different functional units within the data center.

    Global Data Center IP Traffic: Already in the Zettabyte Era

    Figure 1 summarizes the forecast for data center IP traffic growth from 2010 to 2015.

    Figure 1. Global Data Center IP Traffic Growth


    The Internet may not reach the zettabyte era until 2015, but the data center has already entered the zettabyte era. While the amount of traffic crossing the Internet and IP WAN networks is projected to reach nearly 1 zettabyte per year in 20151, the amount of data center traffic is already over 1 zettabyte per year, and by 2015 will quadruple to reach 4.8 zettabytes per year. This represents a 33 percent CAGR. The higher volume of data center traffic is due to the inclusion of traffic inside the data center. (Typically, definitions of Internet and WAN stop at the boundary of the data center.)

    The global data center traffic forecast, a major component of the Global Cloud Index, covers network data centers worldwide operated by service providers as well as private enterprises. Please see Appendix A for details on the methodology of the data center and cloud traffic forecasts.

    Data Center Traffic Destinations: Most Traffic Stays Within the Data Center

    Consumer and business traffic flowing through data centers can be broadly categorized into three main areas (Figure 2):

    • Traffic that remains within the data center

    • Traffic that flows from data center to data center

    • Traffic that flows from the data center to end users through the Internet or IP WAN

    Figure 2. Global Data Center Traffic by Destination


    In 2010, 77 percent of traffic remains within the data center, and this will decline only slightly to 76 percent by 2015.2

    The fact that the majority of traffic remains within the data center can be attributed to several factors:

    • Functional separation of application servers and storage, which requires all replication and backup traffic to traverse the data center

    • Functional separation of database and application servers, such that traffic is generated whenever an application reads from or writes to a central database

    • Parallel processing, which divides tasks into multiple smaller tasks and sends them to multiple servers, contributing to internal data center traffic

    The ratio of traffic exiting the data center to traffic remaining within the data center might be expected to increase over time, because video files are bandwidth-heavy and do not require database or processing traffic commensurate with their file size. However, the ongoing virtualization of data centers offsets this trend. Virtualization of storage, for example, increases traffic within the data center because virtualized storage is no longer local to a rack or server. Table 1 provides details for global data center traffic growth rates.

    Table 1. Global Datacenter Traffic, 2010-2015


    Data Center IP Traffic, 2010-2015


    2010

    2011

    2012

    2013

    2014

    2015

    CAGR
    2010-2015

    By Type (PB per Year)

    Data Center-to-User

    179

    262

    363

    489

    635

    815

    36%

    Data Center-to-Data Center

    75

    110

    150

    198

    252

    322

    34%

    Within Data Center

    887

    1,279

    1,727

    2,261

    2,857

    3,618

    33%

    By Segment (PB per Year)

    Consumer

    865

    1,304

    1,815

    2,429

    3,111

    4,021

    36%

    Business

    276

    347

    425

    520

    633

    735

    22%

    By Type (PB per Year)

    Cloud Data Center

    131

    257

    466

    765

    1,114

    1,642

    66%

    Traditional Data Center

    1,010

    1,394

    1,775

    2,184

    2,629

    3,114

    25%

    Total (PB per Year)

    Total Datacenter Traffic

    1,141

    1,651

    2,240

    2,949

    3,744

    4,756

    33%


    Source: Cisco Global Cloud Index, 2011

    Definitions

    Data Center-to-User: Traffic that flows from the data center-to-end users through the Internet or IP WAN

    Data Center-to-Data Center: Traffic that flows from data center-to-data center

    Within Data Center: Traffic that remains within the data center

    Consumer: Traffic originating with or destined for personal end-users

    Business: Traffic originating with or destined for business end-users

    Cloud Data Center: Traffic associated with cloud consumer and business applications

    Traditional Data Center: Traffic associated with non-cloud consumer and business applications

    Transitioning Workloads to Cloud Data Centers

    A workload can be defined as the amount of processing a server undertakes to execute an application and support a number of users interacting with the application. The Global Cloud Index forecasts the transition of workloads from traditional data centers to cloud data centers. The year 2014 is expected to be a pivotal year-when workloads processed in cloud data centers (51 percent) will exceed those processed in traditional data centers (49 percent) for the first time. Continuing that trend, we expect cloud-processed workloads to dominate at 57 percent by 2015 (Figure 3).

    Figure 3. Workload Distribution: 2010˗2015


    Source: Independent Analyst Shipment Data, Cisco Analysis

    Traditionally, one server carried one workload. However, with increasing server computing capacity and virtualization, multiple workloads per physical server are common in cloud architectures. Cloud economics, including server cost, resiliency, scalability, and product lifespan, are promoting migration of workloads across servers, both inside the data center and across data centers (even centers in different geographic areas). Often an end user application can be supported by several workloads distributed across servers. This can generate multiple streams of traffic within and between data centers, in addition to traffic to and from the end user. Table 2 provides details regarding workloads shifting from traditional data centers to cloud data centers.

    Table 2. Workload Shift from Traditional Data Center to Cloud Data Center


    Global Datacenter Workloads in Millions


    2010

    2011

    2012

    2013

    2014

    2015

    CAGR 2010-2015

    Traditional Data Center Workloads

    45.3

    49.2

    52.6

    58.1

    64.0

    66.6

    8%

    Cloud Data Center Workloads

    12.2

    21.0

    33.2

    49.3

    67.3

    88.3

    48%

    Total Data Center Workloads

    57.5

    70.2

    85.8

    107.4

    131.2

    154.8

    22%


    Cloud Workloads as a Percentage of Total Data Center Workloads

    21%

    30%

    39%

    46%

    51%

    57%


    Traditional Workloads as a Percentage of Total Data Center Workloads

    79%

    70%

    61%

    54%

    49%

    43%


    Global Cloud IP Traffic Growth

    Data center traffic on a global scale grows at 33 percent CAGR (Figure 4), but cloud data center traffic grows at a much faster rate of 66 percent CAGR, or twelvefold growth between 2010 and 2015 (Figure 5).

    Figure 4. Total Data Center Traffic Growth


    Figure 5. Cloud Data Center Traffic Growth


    By 2015, more than one-third of all data center traffic will be based in the cloud. The two main causes of this growth are the rapid adoption and migration to a cloud architecture and the ability of cloud data centers to handle significantly higher traffic loads. Cloud data centers support increased virtualization, standardization, automation, and security. These factors lead to increased performance, as well as higher capacity and throughput.

    Global Business and Consumer Cloud Growth

    For the purposes of this study, the Global Cloud Index characterizes traffic based on services delivered to the end user. Business data centers are typically dedicated to organizational needs and handle traffic for business needs that may adhere to stronger security guidelines (Figure 6). Consumer data centers typically cater to a wider audience and handle traffic for the mass consumer base (Figure 7).

    Figure 6. Business Traditional and Cloud Data Centers


    Figure 7. Consumer Traditional and Cloud Data Centers


    Within the cloud data center traffic forecast, consumer traffic leads with a CAGR of 39 percent. At 14 percent of total cloud traffic in 2010, consumer traffic is forecast to become more than one-third of all cloud traffic in 2015. Business cloud traffic grows at a CAGR of 25 percent, starting with 6 percent of cloud traffic in 2010 and expected to rise to 19 percent in 2015. Table 3 provides details for global cloud traffic growth rates.

    Table 3. Global Cloud Traffic, 2010-2015


    Cloud IP Traffic, 2010-2015


    2010

    2011

    2012

    2013

    2014

    2015

    CAGR
    2010-2015

    By Segment (PB per Year)

    Consumer

    115

    226

    413

    686

    1,005

    1,503

    67%

    Business

    16

    31

    52

    79

    109

    139

    53%

    Total (PB per Year)

    Total Cloud Traffic

    131

    257

    466

    765

    1,114

    1,642

    66%


    Source: Cisco Global Cloud Index

    Global Cloud Readiness

    The cloud readiness segment of this study offers a regional view of the fundamental requirements for broadband and mobile networks to deliver next-generation cloud services. The enhancements and reliability of these requirements will support the increased adoption of business-grade and consumer-grade cloud computing. For instance, it is important for consumers to be able to download music and videos on the road as well as for business users to have continuous access to videoconferencing and mission-critical customer relationship management (CRM) and enterprise resource planning (ERP) systems. Download and upload speeds as well as latencies are vital measures to assess network capabilities of cloud readiness. Figure 8 provides the sample business and consumer cloud service categories and the corresponding network requirements used for this study. Regional network performance statistics were ranked by their ability to support these three cloud service categories.

    Figure 8. Sample Business and Consumer Cloud Service Categories


    Over 45 million records from Ookla3 and the International Telecommunication Union (ITU) were analyzed from nearly 150 countries around the world. The regional averages of these measures are included in this report. Individual countries may have slightly or significantly higher or lower averages compared to the regional averages for download speed, upload speed, and network latency. For example, while the overall Asia Pacific region is less ready for cloud services compared to other regions because several individual countries contribute lower speeds and higher latencies, individual countries within the region such as South Korea and Japan show significantly higher readiness. Please see Appendix E for further details on outlier or lead countries per region. The cloud readiness characteristics are as follows.

    Broadband ubiquity: This indicator measures fixed and mobile broadband penetration while considering population demographics to understand the pervasiveness and expected connectivity in various regions.

    Download speed: With increased adoption of mobile and fixed bandwidth-intensive applications, end user download speed is an important characteristic. This indicator will continue to be critical for the quality of service delivered to virtual machines, CRM and ERP cloud platforms for businesses, and video download and content retrieval cloud services for consumers.

    Upload speed: With the increased adoption of virtual machines, tablets, and videoconferencing in enterprises as well as by consumers on both fixed and mobile networks, upload speeds are especially critical for delivery of content to the cloud. The importance of upload speeds will continue to increase over time, promoted by the dominance of cloud computing and data center virtualization, the need to transmit many millions of software updates and patches, the distribution of large files in virtual file systems, and the demand for consumer cloud game services and backup storage.

    Network latency: Delays experienced with voice over IP (VoIP), viewing and uploading videos, online banking on mobile broadband, or viewing hospital records in a healthcare setting, are due to high latencies (usually reported in milliseconds). Reducing delay in delivering packets to and from the cloud is crucial to delivering today's advanced services.

    Broadband Ubiquity

    Figure 9 summarizes broadband penetration by region in 2011. For further details, please refer to Appendix D.

    Figure 9. Regional Broadband Ubiquity, 2011


    Source: ITU, Informa Media and Telecoms, Cisco Analysis

    Download and Upload Speed Overview

    In 2011, global average download speeds are 4.9 Mbps, with global average fixed download speeds at 6.7 Mbps and global average mobile download speeds at 3 Mbps. Global average upload speeds are 2.7 Mbps, with global average fixed upload speeds at 3.7 Mbps and global average mobile upload speeds at 1.6 Mbps.

    Western Europe leads in overall average fixed and mobile download speeds of 12.5 Mbps, with Central and Eastern Europe next with 9.3 Mbps.

    Fixed Download Speeds

    For average consumer fixed download speeds (Figure 10), Western Europe leads with 9.4 Mbps and North America follows with 8.4 Mbps. Western Europe averages 16.8 Mbps for fixed business speeds and Central and Eastern Europe averages 11.9 Mbps. For each region's peak download and upload speeds, see Appendix E.

    Figure 10. Business and Consumer Fixed Download Speeds by Region


    Source: Cisco Analysis of Ookla Speedtest Data, 2011

    Mobile Download Speeds

    Western Europe leads in overall mobile download speeds of 4.9 Mbps and North America closely follows with 4.6 Mbps, making them the most cloud-ready regions from a download-speed perspective. Central and Eastern Europe lead in business mobile download speeds of 6.1 Mbps, and Western Europe is next with download speeds of 5.8 Mbps (Figure 11). North America leads in average mobile consumer download speeds with 4.6 Mbps and Western Europe is next with 4.5 Mbps. Please refer to Appendix E for further details.

    Figure 11. Business and Consumer Mobile Download Speeds by Region


    Source: Cisco Analysis of Ookla Speedtest Data, 2011

    Fixed Upload Speeds

    Global average upload speeds are 2.7 Mbps. Average global fixed upload speeds are 3.7 Mbps. Western Europe leads with an average upload speed of 5.9 Mbps and Central and Eastern Europe follows with 5.7 Mbps, making them the most cloud ready from an upload speed perspective. Average global business fixed upload speeds are 6.5 Mbps. Western Europe leads with 11.2 Mbps and Central Eastern Europe is next with 8 Mbps (Figure 12). Average global consumer upload speeds are 2.1 Mbps, with Central and Eastern Europe leading with 4 Mbps and APAC next with 3.1 Mbps (Figure 13). Please refer to Appendix E for further details.

    Figure 12. Business and Consumer Fixed Upload Speeds by Region


    Source: Cisco Analysis of Ookla Speedtest Data, 2011

    Mobile Upload Speeds

    Global average mobile upload speeds are 1.6 Mbps. Average global mobile business upload speeds are higher at 2.7 Mbps, while average consumer mobile upload speeds are 1.1 Mbps. Central and Eastern Europe leads with overall average mobile upload speeds of 2.5 Mbps and Western Europe follows with 2.3 Mbps, making them the most cloud ready regions from an mobile upload speed perspective. Central and Eastern Europe leads in average consumer mobile upload speed of 1.8 Mbps and North America follows with 1.3 Mbps. Central and Eastern Europe leads with business mobile upload speeds of 4.1 Mbps and Western Europe is next with 4 Mbps. Please refer to Appendix E for further details.

    Figure 13. Business and Consumer Mobile Upload Speeds by Region


    Source: Cisco Analysis of Ookla Speedtest Data, 2011

    Network Latency

    Overall average fixed and mobile global latency is 201 ms. Global average fixed latency is 125 and average mobile latency is 290. Western Europe leads in fixed latency with 63 ms and North America closely follows with 75 ms, making these two regions the most cloud ready from a fixed latency perspective. Western Europe leads from the mobile latency perspective with 147 ms and Central and Eastern Europe follows with 173 ms, making these two regions the most cloud ready from a mobile latency perspective. Global business latency is 169.7 ms and consumer latency is higher at 217.3 ms. Average global fixed business latency is 112 ms while fixed consumer latency is 132.9 ms.

    Figure 14 shows latencies by region. Western Europe leads in fixed business latencies with 61 ms and Central and Europe is next with 63 ms. North America leads in fixed consumer latencies with 63.3 ms and Western Europe is next with 72 ms. Global mobile business average latency is 251 with Central and Eastern Europe experiencing the best latency at 111.3 ms and Western Europe next with 126.7 ms. Global mobile consumer average latency is 307.3 ms, with Western Europe leading with 159 ms and North America next with 173 ms. Please refer to Appendix E for further details.

    Figure 14. Business and Consumer Network Latencies by Region


    Source: Cisco Analysis of Ookla Speedtest Data, 2011

    Application Readiness

    As new models of service delivery and cloud-based business and consumer application consumption evolve, the fundamentals of network characteristics are essential. Fixed and mobile broadband penetration, download and upload speeds, and latency are indicators of readiness for delivery to and consumption from the cloud. Furthermore, although speeds and latency are significant to all interested in assessing the quality of broadband services, they are not the only metrics that matter. Understanding basic broadband measures provides insight into which applications are most likely to benefit from faster broadband services for end consumers and business users. With business and consumer applications alike, advancements in video codecs, traffic optimization technologies, and more, in addition to speeds and latencies, will lead to additional mechanisms to isolate speed bottlenecks at different points along the end-to-end paths and lead to other technical measures that will give a better understanding of how to deliver the best quality of experience.

    All of the regions have some level of cloud readiness based on their average upload/download speeds and latencies, as shown in Figure 15. Asia Pacific, Western Europe, North America, and Central and Eastern Europe are better prepared for the intermediate cloud applications such as streaming high-definition video. The Middle East and Africa and Latin America can support basic cloud services. None of the regions' current average network performance characteristics can support advanced cloud services today. Most regions have some outlier countries with network performance results that are higher than their region's average cloud readiness metrics. For example, S. Korea and Japan in APAC and Egypt; South Africa and UAE in MEA.

    Figure 15. End User Cloud Application Readiness


    Conclusion

    In conclusion, here's a summary and key takeaways from our first Global Cloud Index.

    In terms of data center and cloud traffic, we are firmly in the zettabyte era. Global datacenter traffic will grow four-fold from 2010 to 2015 and reach 4.8 zettabytes annually by 2015. A subset of data center traffic is cloud traffic, which will grow 12-fold over the forecast period and represent over one-third of all data center traffic by 2015.

    A key traffic driver as well as an indicator of the transition to cloud computing is increasing data center virtualization. The growing number of end user devices combined with consumer and business users preference or need to stay connected is creating new network requirements. The evolution of cloud services is driven in large part by users' expectations to access applications and content anytime, from anywhere, over any network and with any device. Cloud-based data centers can support more virtual machines and workloads per physical server than traditional datacenters. By 2014, more than 50% of all workloads will be processed in the cloud.

    From a cloud readiness perspective, the study covers the importance of broadband ubiquity. Based on the regional average download and upload speeds and latencies for business and consumer connections, all regions can support some level of cloud services. However, few regions' average network characteristics are currently able to support the high-end advanced cloud apps.

    For More Information

    For more information, please see www.cisco.com/go/cloudindex.

    Appendix A: Data Center Traffic Forecast Methodology

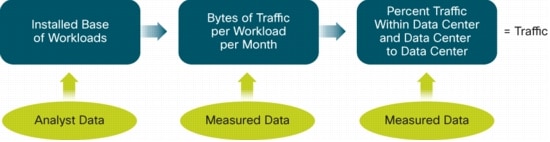
    Figure 16 outlines the methodology used to forecast data center and cloud traffic. The methodology begins with the installed base of workloads by workload type and implementation and then applies the volume of bytes per workload per month to obtain the traffic for current and future years.

    Figure 16. Data Center Traffic Forecast Methodology


    Analyst Data

    Data from several analyst firms was used to calculate an installed base of workloads by workload type and implementation (cloud or noncloud). The analyst input consisted of server shipments with specified workload type and implementation. Cisco then estimated the installed base of servers and the number of workloads per server to obtain an installed base of workloads.

    Measured Data

    Network data was collected from 10 enterprise and Internet centers. The architectures of the data centers analyzed vary, with some having a three-tiered and others a two-tiered data center architecture. For the three-tiered data centers, data was collected from four points: the link from the access routers to the aggregation routers, the link from the aggregation switches or routers to the site or regional backbone router, the WAN gateway, and the Internet gateway. From two-tiered data centers, data was collected from three points: the link from the access routers to the aggregation routers, the WAN gateway, and the Internet gateway.

    For enterprise data centers, any traffic measured northbound of the aggregation also carries non-data-center traffic to and from the local business campus. For this reason, in order to obtain ratios of the volume of traffic being carried at each tier, it was necessary to measure the traffic by conversations between hosts rather than traffic between interfaces, so that the non-data-center conversations could be eliminated. The hosts at either end of the conversation were identified and categorized by location and type. To be considered data center traffic, at least one of the conversation pairs had to be identified as appearing in the link between the data center aggregation switch or router and the access switch or router. A total of 50,000 conversations were cataloged, representing a volume of 30 terabytes of traffic for each month that was analyzed. Included in this study were the 12 months ending September 30, 2011.

    Appendix B: Mobility and Multiple Device Ownership are Primary Promoters of Cloud Application Adoption

    Figure 17 shows the proliferation of multiple device ownership.

    Figure 17. Per-User Ownership of Devices Connected to the Internet


    Internet users are using multiple devices to connect to the Internet, and these devices are increasingly mobile. It is no longer feasible for these users to manually replicate content and applications to each of their devices. While storing content on a peripheral drive connected to the local home or business network was once an elegant solution, the increasing mobility of Internet devices is making cloud storage a more attractive option.

    • Nearly 70 percent of Internet users will use more than five network-connected devices in 2015, up from 36 percent at the end of 2010. These devices include laptops, desktops, smartphones, tablets, Internet-connected televisions, set-top boxes, game consoles, digital photo frames, and other Internet-connected electronics.

    • The average business will need to support twice as many end-user devices in 2015 as in 2010, and the diversity of these devices will continue to grow. The days of restricting network access to identical company-issued PCs are soon to pass.

    Appendix C: With the Cloud Comes Complexity

    Figure 18 illustrates the complexity that accompanies cloud-based computing.

    Figure 18. One Video, One User, Seventeen Paths in 2015


    With the cloud, users can access their content and applications on many devices. Each of these devices may have the capability to support multiple network connections and multiple displays. Each network connection has particular latency and speed signatures, and each display has its own aspect ratio and resolution. Each cloud application may incorporate multiple content sources and may be linked with a number of other applications. The cloud is a multidimensional environment, and the resulting complexity can be astounding.

    Although there may be many ways to measure the complexity of data center operations and how that will change with the advent of cloud applications, a simple complexity gauge can be created by counting the possible combinations of users, devices, displays, connections, and content sources (Table 4).

    Table 4. Data Center Complexity


    Data Center Complexity Factors

    2010

    2015

    Number of Internet users

    1.9 Billion

    3.1 Billion

    Number of devices per user

    3.4

    3.9

    Number of connection types per device

    1.3

    1.4

    Number of display types per device

    1.1

    1.3

    Number of applications per user

    2.5

    3.5

    Number of content sources per application

    1.5

    2.3

    Possible combinations

    33 Billion

    183 Billion


    By this measure, data center complexity will increase fivefold between 2010 and 2015. Another way to look at these numbers is to limit the scenario to a single piece of content and a single user. In 2005, a single piece of content had an average of three paths to a user: it might have traveled through a mobile connection to a smartphone and been displayed on a mobile screen by a mobile application, or it might have traveled through a fixed connection to a laptop and been displayed on a laptop or large display by a PC application. In 2010, the situation was considerably more complex: a single piece of content had seven possible paths to the user. In 2015, a single piece of content will have 17 possible paths to the user.

    Appendix D: Regional Cloud Readiness Summary

    Tables 5 and 6 summarize cloud readiness by region.

    Table 5. Regional Cloud Readiness


    Network

    Segment

    Region

    Average Download (kbps)

    Average Upload (kbps)

    Average Latency (ms)

    Fixed

    Business

    APAC

    9,163

    7,220

    103


    CEE

    11,994

    8,095

    63


    LATAM

    3,119

    2,085

    151


    MEA

    2,354

    1,396

    245


    NA

    8,552

    4,952

    87


    WE

    16,759

    11,219

    61


    Business Average


    9,371

    6,489

    112


    Consumer

    APAC

    5,757

    3,166

    124


    CEE

    7,422

    4,003

    84


    LATAM

    2,070

    721

    151


    MEA

    1,691

    795

    225


    NA

    8,415

    1,778

    63


    WE

    9,369

    2,380

    72


    Consumer Average


    5,082

    2,096

    133

    Fixed Average


    6,674

    3,726

    125

    Mobile

    Business

    APAC

    3,125

    2,272

    300


    CEE

    6,091

    4,075

    111


    LATAM

    1,566

    1,079

    386


    MEA

    1,265

    807

    509


    NA

    4,674

    2,935

    204


    WE

    5,817

    4,037

    127


    Business Average


    3,992

    2,750

    251


    Consumer

    APAC

    2,159

    1,025

    305


    CEE

    3,430

    1,800

    200


    LATAM

    1,444

    609

    384


    MEA

    1,167

    490

    508


    NA

    4,580

    1,304

    173


    WE

    4,455

    1,294

    159


    Consumer Average


    2,567

    1,047

    307

    Mobile Average


    3,005

    1,571

    290

    Global Average


    4,987

    2,735

    201


    Source: Ookla Speedtest Data and Cisco Analysis 2011

    Table 6. Regional Broadband Penetration (Percentages Indicate Users with Broadband Access Per Region)


    Region

    Fixed Broadband Subscriptions (2011)

    Mobile Broadband Users (2011)

    Population

    Asia Pacific (APAC)

    217,136,050 (6%)

    198,471,250 (6%)

    3,779,499,930

    Central and Eastern Europe (CEE)

    41,361,106 (10%)

    31,987,471 (8%)

    405,220,643

    Latin America (LATAM)

    39,277,443 (7%)

    39,934,907 (4%)

    577,978,544

    Middle East and Africa (MEA)

    8,638,426 (1%)

    14,536,458 (2%)

    1,045,062,933

    North America (NA)

    91,882,741 (27%)

    187,160,230 (54%)

    344,352,893

    Western Europe (WE)

    128,637,208 (26%)

    116,954,942 (18%)

    491,668,145


    Source: ITU, Informa Telecoms and Media 2011

    Appendix E: Regional Download and Upload Peak Speeds

    Download and upload peak speeds measured (shown in Tables 7 through 9) are the average 95th percentile sample for all countries per region, which represents the highest speed capabilities by region. From an average fixed peak download perspective, Western Europe leads with 64 Mbps and North America follows with 45.1 Mbps.

    Table 7. Regional Download and Upload Peak Speeds


    Network

    Segment

    Region

    Average of Peak Download

    Average of Peak Upload

    Fixed

    Business

    APAC

    45,512

    144,791


    CEE

    58,698

    167,676


    LATAM

    15,086

    55,233


    MEA

    13,310

    39,232


    NA

    60,923

    411,957


    WE

    100,371

    256,335


    Business Total


    50,545

    149,295


    Consumer

    APAC

    22,144

    102,934


    CEE

    33,530

    158,827


    LATAM

    7,422

    36,697


    MEA

    9,187

    51,013


    NA

    29,343

    449,401


    WE

    40,158

    170,471


    Consumer Average


    21,592

    104,406

    Fixed Average


    32,339

    121,068

    Mobile

    Business

    APAC

    11,924

    30,057


    CEE

    17,956

    29,277


    LATAM

    5,752

    35,256


    MEA

    5,438

    15,420


    NA

    17,795

    436,817


    WE

    17,366

    31,193


    Business Average


    12,999

    43,178


    Consumer

    APAC

    8,102

    52,155


    CEE

    12,113

    43,488


    LATAM

    5,681

    30,882


    MEA

    4,570

    24,670


    NA

    15,714

    1,271,508


    WE

    14,664

    667,195


    Consumer Average


    9,144

    182,056

    Mobile Average


    10,330

    139,325

    Grand Average


    22,217

    129,464


    Table 8. Fixed Speeds by Lead Countries Per Region


    Region

    Average Download (kbps)

    Average Upload (kbps)

    Average Latency (ms)

    APAC

    Australia

    11,383

    5,897

    65

    China

    2,623

    1,961

    142

    India

    1,252

    991

    140

    Japan

    23,063

    15,058

    42

    New Zealand

    7,275

    3,206

    66

    South Korea

    29,805

    18,670

    38

    CEE

    Latvia

    18,420

    13,428

    45

    Lithuania

    16,261

    11,479

    60

    Russia

    6,684

    6,522

    82

    LATAM

    Argentina

    2,038

    796

    83

    Brazil

    3,406

    674

    100

    Chile

    9,624

    7,836

    124

    Mexico

    2,851

    729

    110

    NA

    Canada

    9,137

    3,645

    68

    United States

    7,831

    3,085

    82

    WE

    Belgium

    16,085

    6,419

    42

    France

    23,458

    12,925

    70

    Germany

    18,916

    8,530

    78

    Italy

    6,037

    3,815

    75

    Netherlands

    23,063

    11,977

    51

    Sweden

    15,536

    6,534

    57

    United Kingdom

    10,987

    4,990

    76

    MEA

    United Arab Emirates

    6,577

    2,055

    63

    South Africa

    2,324

    870

    112

    Egypt

    911

    338

    141


    Table 9. Mobile Speeds by Lead Countries Per Region


    Region

    Average Download (kbps)

    Average Upload (kbps)

    Average Latency (ms)

    APAC

    Australia

    3,223

    1,251

    225

    China

    1,106

    966

    505

    India

    966

    952

    339

    Japan

    6,037

    4,831

    135

    New Zealand

    3,917

    1,532

    151

    South Korea

    6,708

    5,368

    122

    CEE

    Latvia

    5,808

    3,544

    155

    Lithuania

    4,888

    2,789

    152

    Russia

    4,913

    3,994

    195

    LATAM

    Argentina

    1,433

    718

    245

    Brazil

    1,931

    614

    285

    Chile

    4,241

    3,511

    251

    Mexico

    1,821

    633

    250

    NA

    Canada

    5,035

    2,473

    172

    United States

    4,219

    1,766

    205

    WE

    Belgium

    6,379

    2,495

    120

    France

    4,114

    2,589

    154

    Germany

    5,989

    3,804

    137

    Italy

    3,594

    2,450

    167

    Netherlands

    8,389

    4,712

    91

    Sweden

    3,948

    1,887

    141

    United Kingdom

    5,028

    2,813

    147

    MEA

    United Arab Emirates

    5,276

    1,506

    118

    South Africa

    1,607

    720

    247

    Egypt

    768

    368

    332


    My Blog List

    Networking Domain Jobs